

Best Wafer Cleaning System: How to Evaluate and Select the Right Solution
2026-10-14
Selecting a wafer cleaning system feels like choosing between a dozen near-identical promises: every vendor claims the lowest particle counts, the gentlest megasonic energy, and the most robust chemistry. But real fabs know the truth—small differences in cleaning uniformity or chemical compatibility can crater yields months down the line. In this guide, we cut through the noise with a practical evaluation framework, and we flag where solutions like Siansonic actually move the needle.
Map Your Contamination Sources and Acceptable Defect Density First
Before chasing tighter specs or fancier inspection gear, sit down with your team and sketch out exactly where contamination might creep in. Walk the line from raw material intake through every handling step, tooling change, and packaging handoff. Mark the points where human hands, ambient air, shared fixtures, or upstream process residue could introduce particles, films, or chemical traces. This isn't about creating a perfect theoretical map—it's about forcing everyone to agree on the real, physical pathways that exist today, not the ones you wish existed.
Once the sources are visible, pair each one with a practical tolerance for defect density. Don't default to "zero defects" as a slogan; instead, ask what level of contamination actually degrades function, yield, or customer perception for your specific product. A medical catheter tip has a different acceptable count than a motor housing interior. Write those numbers down, even if they're rough ranges, and make them the baseline for judging whether a process change or new cleaning method is actually helping.
This mapping exercise also reveals where your current inspection effort is wasted. If you're spending hours counting particles in a zone that downstream rinsing already handles, you can shift that attention to a riskier transfer point. The goal is to allocate your cleanliness budget—time, money, and attention—according to the real contamination map, not a generic checklist. Revisit the map whenever a supplier, material, or layout changes, and keep the acceptable defect density tied to field data and scrap trends, not guesswork.
Test Cleaning Chemistries on Your Actual Device Wafers, Not Monitors
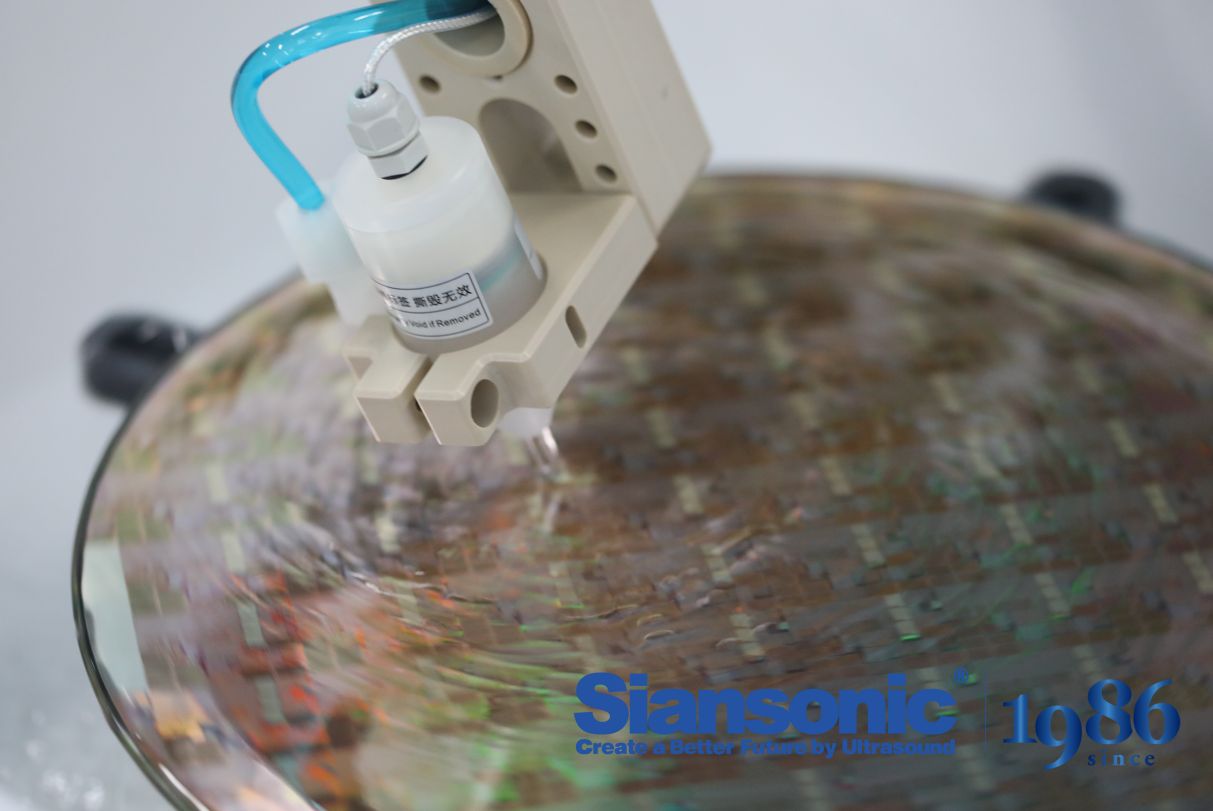
Monitor wafers give you a false sense of security. A bare silicon coupon with a blanket oxide film tells you almost nothing about how a cleaning chemistry will behave on your real product wafers, where dense device structures, varying film stacks, and high-aspect-ratio features completely change etch rates, particle adhesion, and residue removal. If you only qualify a clean on monitors, you may ship wafers that pass inspection but carry latent defects hidden inside actual device patterns.
Device wafers expose problems that monitors never will. Pattern collapse, galvanic corrosion at metal interfaces, selective attack of low-k dielectrics, or insufficient removal of post-etch polymer inside narrow trenches all show up only when the chemistry meets the real topography. By testing on product or short-loop device wafers, you capture those failure modes early, before they become yield excursions or reliability field returns.
The extra cost of sacrificing a few device wafers for cleaning validation is trivial compared to the cost of discovering a chemistry incompatibility after ramp. Make it a rule: no cleaning chemistry gets released to production until it has been tested on actual device wafers under the same conditions as the manufacturing line. Monitors are for routine process control, not for qualifying new cleans.
Let Queue Time Data Choose Between Single-Wafer and Batch Tools
Queue time records from your MES or scheduling system often expose patterns that blanket tool-selection rules miss. Instead of assuming every layer benefits from a batch furnace or a single-wafer etcher, look at how long lots actually sit between operations. Short, sporadic queues suggest single-wafer tools prevent idle waiting and reduce overall cycle time. Long, predictable queues indicate enough volume builds up naturally to fill a batch without artificial delay.
For products with tight process windows, queue time data can flag when a lot is about to exceed its allowed wait. In those moments, a single-wafer tool's immediate availability avoids scrap, while a batch tool would either force a risky wait or require running a partially filled chamber. Conversely, when data shows queues consistently deep enough to run full loads, batch processing lowers cost per wafer and improves tool utilization without adding meaningful delay.
Let the measured distribution of queue times set the threshold. If most lots wait less than the minimum economic batch size time, single-wafer is the right default. If queue time data shows a bimodal pattern with a clear high-volume stream, split the line and route only that stream to batch tools. This data-driven choice removes guesswork and keeps both cycle time and cost in balance.
Look at Drying Performance and Residue Risk Before Chemical Cost
Drying speed shapes more than just throughput. A product that lingers on leaves or fruit invites moisture-loving pathogens, spray overlap issues, and harvest delays. Before fixating on price per gallon, ask how long the active ingredient stays wet and whether it leaves behind a sticky film that could complicate packing or processing.
Residue risk is the hidden cost that rarely appears on an invoice. Some formulations look cheap until you factor in re-washing, export rejections, or extra days waiting for safe re-entry. Check the label for pre-harvest intervals and test a small block first if you are switching from a familiar chemistry. A few cents saved can evaporate quickly when residue forces a downgrade.
Treat chemical cost as the last checkpoint, not the first filter. Start with drying behavior under your local humidity and temperature swings, then assess how the residue behaves on your specific crop surface. Only after those two pass should you compare unit prices, because the cheapest product on paper often costs the most in the field.
Review Preventive Maintenance Logs and Mean Time Between Failures
Digging through preventive maintenance logs isn't just a box-ticking exercise—it's a way to spot patterns that never show up in daily reports. When you map out every scheduled task, completed or delayed, against actual equipment breakdowns, the story of your machinery starts to surface. A pump that was serviced three times in one quarter but still failed might point to a deeper issue, like incorrect parts or a missed root cause. Pairing these logs with mean time between failures gives you a sharper lens: if the interval is shrinking despite consistent maintenance, the strategy itself needs questioning.
The real value appears when you stop treating logs as historical records and start using them as forward-looking tools. Look for clusters—several pieces of equipment failing shortly after a certain type of maintenance, or a shift team whose logged checks correlate with fewer breakdowns. These aren't coincidences. They reveal whether your preventive actions are truly preventive or just procedural theater. Calculating MTBF over rolling windows, say 30 or 90 days, helps you see trends early, before a single unexpected failure becomes a production halt.
To make this review genuinely useful, don't just file the numbers. Compare planned maintenance intervals against actual failure times. If a bearing is supposed to last 2,000 hours but keeps dying at 1,200, your schedule is off—either too optimistic or the operating conditions changed. Adjust the intervals based on what the logs and MTBF data tell you, and document those adjustments. This turns a passive review into a feedback loop that reduces downtime and extends asset life without adding extra work.
Calculate Five-Year Water, Chemical, and Energy Use per Wafer Pass
A meaningful five-year estimate starts by splitting fixed facility loads from variable process loads. A single wafer pass through a lithography cell might use 8–12 liters of ultrapure water for developer rinse, but the same tool’s idle purge flows and exhaust abatement add background usage that gets spread across every pass. Static per-pass factors multiply total wafer starts and miss shifts in product mix, rework rates, and the growing share of advanced-node steps that need extra cleaning or CMP passes.
Chemical tracking works better when it follows bath life and dispense volume instead of per-wafer averages. A copper plating bath may treat 200 wafers before partial dump-and-replenish, so chemical use per pass falls as throughput within a bath life improves. Energy reveals more when split into direct tool energy during active processing, exhaust and vacuum loads that run regardless of wafer presence, and facility HVAC that scales with heat removal. Over five years, those subcategories evolve differently as fabs add tools and upgrade abatement systems.
Monthly resolution captures production ramps, scheduled maintenance, and technology transitions more honestly than an annual roll-up. Calibrate per-pass factors with actual utility metering or equipment logs from the past 12–18 months, then apply forward-looking changes such as water recycling ratios or new dry-etch chemistries. The result should be a range—baseline, high-efficiency, and conservative—so sustainability targets and cost forecasts keep enough margin for process variability.
FAQ
The real difference shows up in defect density over time, not just on a spec sheet. A best-in-class tool keeps particle adders below 0.3 per pass on a 20 nm test wafer, holds metal contamination under 1E10 atoms/cm², and does that week after week without constant tuning. Cheaper systems might hit a good number once during acceptance but drift quickly or need frequent chemical bath changes.
Run a split-lot on your own product wafers or at least use particle challenge wafers with known silicon nitride or alumina slurry contamination. Then inspect with a dark-field scanner before and after cleaning, but also do VPD-ICP-MS for surface metals and check the bevel and backside. Many vendors only show frontside LPD counts on bare silicon, which hides edge defects that later kill yield.
Go single-wafer when you have 3D structures, thin wafers, or very short process cycles where cross-contamination between wafers in a batch would be a disaster. It also allows per-wafer chemical tuning. Batch immersion is still fine for blanket films or older nodes where cost per wafer dominates and you don't mind waiting 10-15 minutes for a full cassette.
Dilute SC1 still does a lot of heavy lifting, but the ratio matters: something like 1:4:20 NH4OH:H2O2:H2O at 45°C works better than the old 1:1:5 at 70°C. Adding a non-ionic surfactant at 50-200 ppm improves wetting on hydrophobic surfaces. For stubborn particles, a short dilute HF step followed by ozonated DI water can lift particles by undercutting them, but you have to watch metal redeposition.
Chemical consumption can easily exceed the tool's depreciation over five years, especially if the system uses hot SC1 that needs constant replenishment. Also account for UPW usage, waste neutralization, exhaust scrubbing, and the floor space for ancillary chillers or chemical cabinets. Maintenance downtime is another cost: if a robot arm fails and you don't have a local service contract, a $50k part can sit for three weeks.
Megasonic energy helps dislodge particles from trenches and vias, but only if you control the power density below about 0.5 W/cm² and use a frequency around 1 MHz. Too much power or lower frequency creates transient cavitation that can tear off fins or break high-aspect-ratio structures. A good system scans the transducer across the wafer so the acoustic field doesn't sit in one spot and create a damage pattern.
First day, run 50 bare silicon wafers with poly silicon nitride particles and measure LPDs on both front and backside. Second day, use patterned wafers with 40 nm lines and check for physical damage under SEM. Then do a 500-wafer marathon with the same bath life and log particle counts every 25 wafers to see if there's drift. Finally, test the edge exclusion zone—many tools clean the center well but leave a ring of residue at 2 mm from the edge.
Conclusion
Before comparing any wafer cleaning system, map your contamination sources and define acceptable defect density for each layer. This baseline prevents you from being swayed by impressive particle removal data that doesn't match your actual failure modes. From there, insist on testing cleaning chemistries on your real device wafers, not blanket monitors, because patterned structures and film stacks react very differently to etch rates and residue formation. Queue time data should guide the single-wafer versus batch tool decision: if your process flow can't tolerate long delays between clean and next deposition, a batch platform may introduce new defect risks even while offering higher nominal throughput.
Drying performance and residue risk matter more than raw chemical cost, since a cheap chemistry that leaves watermarks or metallic traces will silently destroy yield. Look closely at preventive maintenance logs and mean time between failures from reference fabs; a tool that performs well in a demo but requires frequent downtime will erode your capacity and engineering time. Finally, calculate five-year water, chemical, and energy consumption per wafer pass rather than per hour, because utility and waste treatment expenses often exceed the initial purchase price over the system's lifetime. Weighing these six practical factors together helps you select a cleaning platform that stays reliable under real production conditions instead of just looking good on a datasheet.
Contact Us
Contact Person: Ivy Zhang
Email: [email protected]
Tel/WhatsApp: +86 1081502288
Website: https://www.siansonic.com/